Memory Analysis using Profiler for Java
|
|
|
|---|---|
|
|
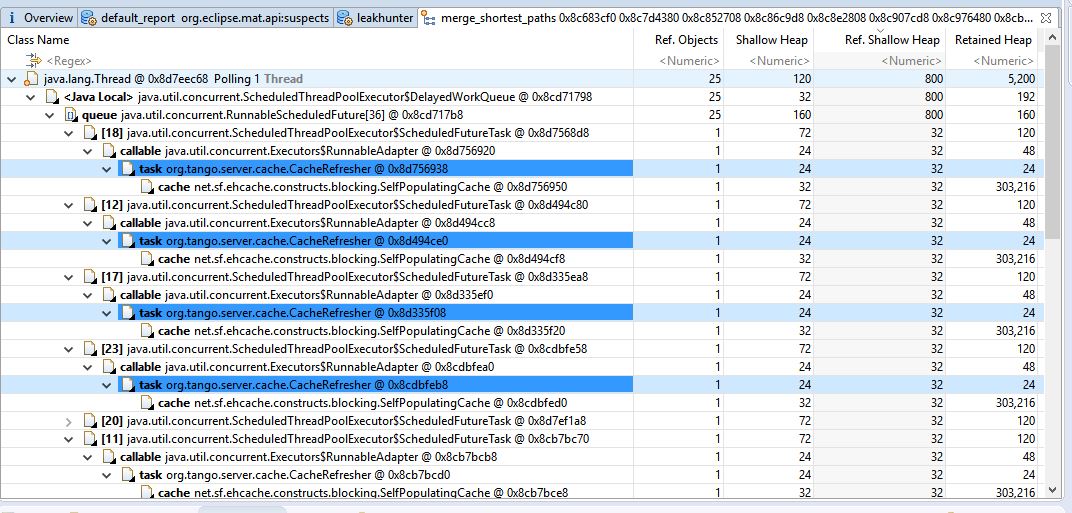
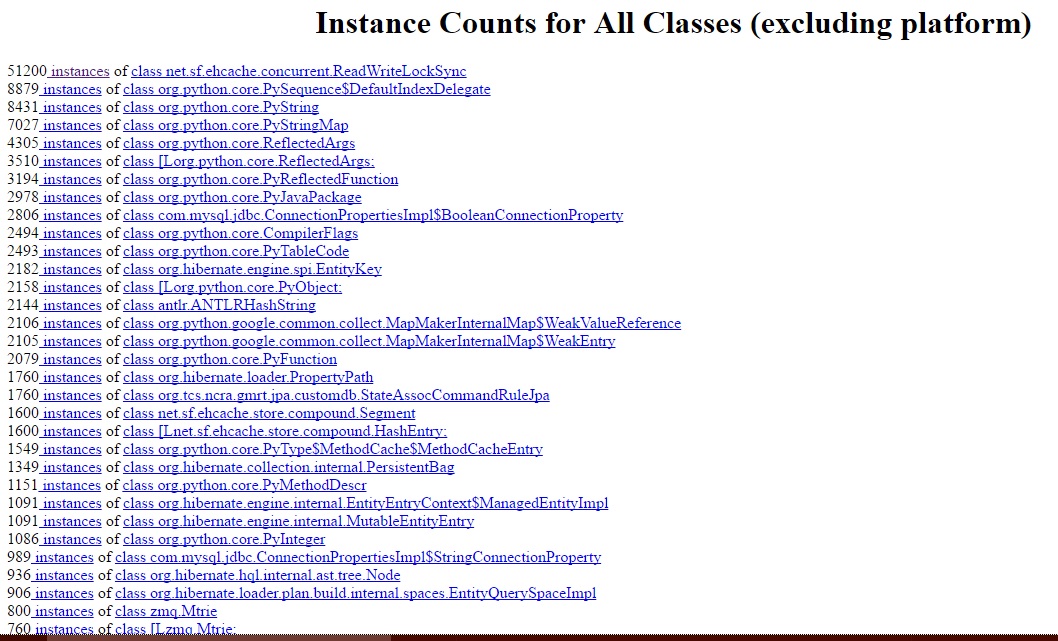
Dear Team, I suspect there is a memory leak when we are running Tango. This is not stopping me from working, but just that I do not want to consume unnecessary memory. I am attaching the screenshot from eclipse MAT, where it says 25 instances of "net.sf.ehcache.constructs.blocking.SelfPopulatingCache", loaded by "sun.misc.Launcher$AppClassLoader @ 0x8be6f440" occupy 7,580,400 (21.37%) bytes. These instances are referenced from one instance of "java.util.concurrent.RunnableScheduledFuture[]", loaded by "" Please can you suggest a way forward
Attachments:
 166Kb 166Kb
|
|
|
|
|---|---|

|
Just to add to …. Please find the screen shot. Please can you help us with this.
Regards,
TCS_GMRT
Attachments:
|
|
|
|
|---|---|

|
Hi, What is the value of your poll ring depth? You can see that in jive by clicking on Polling in the tree, under your device node, in the Settings tab. By default, the poll ring depth is set to 10. This setting defines the size of the cache buffer for every attribute you are polling. There are some commands in Tango to retrieve the latest x values from this cache. So, if you have an attribute polled every second and poll ring depth is set to 3600 for instance, the device server will store the last 3600 values from this attribute, so basically the last hour. So, during the first hour after starting your device server, you will see the memory consumption growing due to this feature but this should stabilize once the polling buffer of every polled attributed reaches the poll ring depth. Maybe you are not in this case, but then, I don't know much how to help you with the information you provided. Kind regards Reynald
Rosenberg's Law: Software is easy to make, except when you want it to do something new.
Corollary: The only software that's worth making is software that does something new. |
|
|
|
|---|---|
|
|
For additional testing, we have created a Tango DS which only prints an attribute value on screen (the value of the attribute is constant and does not change as the program executes). Memory monitoring is done for total of 1:58:42 (H:MM:SS) Analysis from this testing activity revels that memory goes on increasing as time progress. Following (attached) are timed screenshots from JConsole & System Monitor (Ubuntu 16.04). Note: File Name format "Screenshot from YYYY-MM-DD HH-MM-SS" Your help will me appreciated … Additional Information: OS: Ubuntu 16.04 (64 bit) Tango Version: 9.2.2 Java Version: Openjdk version "1.8.0_111" MYSQL Version: Distrib 5.7.16 Ver 14.14 Processor: Intel Core 2 Duo CPU E8400 @ 3.00GHz x 2
Regards,
TCS_GMRT |
 1.32Mb
|
|
|
|---|---|
|
|
Dear Team, Do we have an update … ? Regards, TCS_GMRT
Regards,
TCS_GMRT |
|
|
|
|---|---|

|
Hi, A GitHub repository has been created to track the progress of the investigation, aka issue-1 |