Memory analysis of continuously running tango generated java program
|
|
|
|---|---|

|
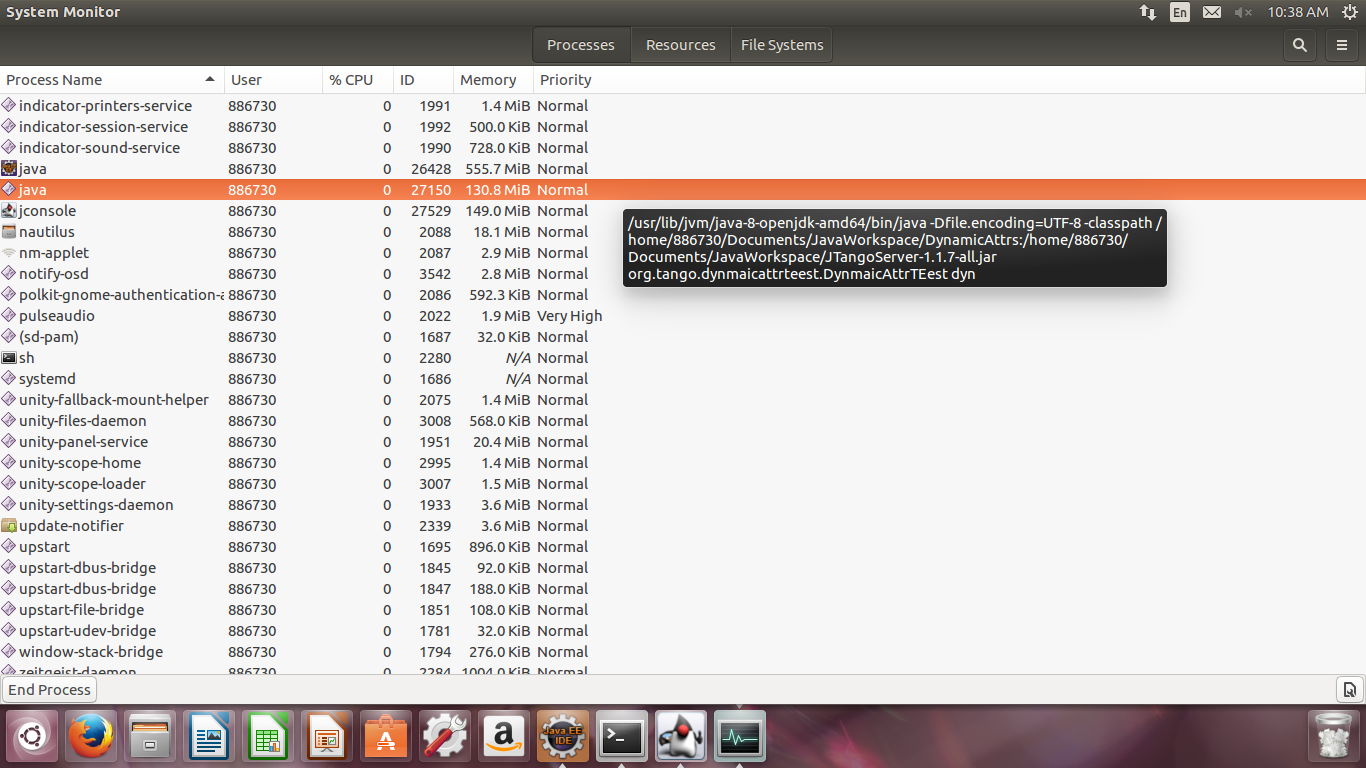
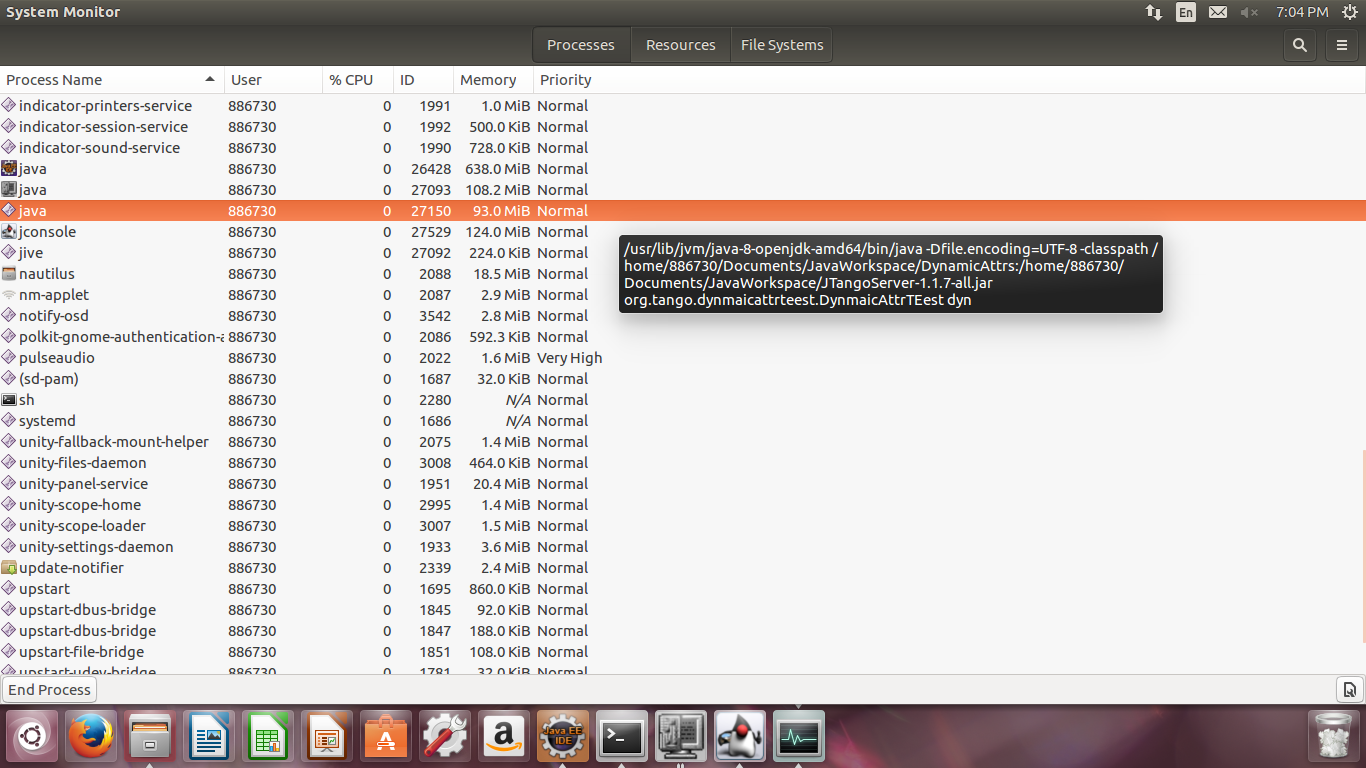
Hi all I have few questions related to memory leakage. The scenario is : - A simple tango generated java program which updates dynamic attributes. - I have tested this code using for 2 days. - When I used JTangoServer-1.1.7-all.jar for executing the program, memory increased from 93 MiB to 130.8 MiB. - And when I tried to execute the same code with JTango-9.0.3.jar , memory increased from 85.4 MiB to 896.7 MiB. - I have used SystemMonitor to know memory usage by the program and attached the same. I could not find the reason behind this memory leakage. Please let me know if anyone know the reason behind this memory issue and solution for the same. Thanks and Regards TCS-GMRT
Regards,
TCS_GMRT
Attachments:


|
|
|
|
|---|---|

|
Could you please create a project on GitHub or bitbucket with the code of your server? Regards, |
|
|
|
|---|---|
|
|
Please find the project attached as a tar file… Let us know in-case your require additional inputs for debugging
Regards,
TCS_GMRT
Attachments:
 78Kb 78Kb
|
|
|
|
|---|---|
|
|
Hi, A GitHub repository has been created to track the progress of the investigation, aka issue-1 |
|
|
|
|---|---|
|
|
TCS_GMRT Do you mean any specific test client, or just running the server? |
|
|
|
|---|---|
|
|
Hi, I have just run the server for 2 days without any interruption.
Regards,
TCS_GMRT |
|
|
|
|---|---|

|
Hi, apparently the problem is with the Garbage Collection: https://github.com/Ingvord/mem-leak-investigation/issues/1#issuecomment-268567220 It seems to be a memory leak. Maybe the profiler can show which objects are concerned: I found this related article about memory leaks in Java: http://www.ibm.com/developerworks/library/j-jtp11225/ I wonder if the problem is related to which version of the JVM you are using? Andy |
|
|
|
|---|---|
|
|
Hi, We are using : openjdk version "1.8.0_111" OpenJDK Runtime Environment (build 1.8.0_111-8u111-b14-2ubuntu0.16.04.2-b14) OpenJDK 64-Bit Server VM (build 25.111-b14, mixed mode). Regards TCS-GMRT
Regards,
TCS_GMRT |
|
|
|
|---|---|
|
|
Hi, Do we have any updates? Regards, TCS_GMRT
Regards,
TCS_GMRT |
|
|
|
|---|---|
|
|
I can not reproduce this behavior anymore. Have you ever experienced an OutOfMemoryError? Because JVM is clever enough (especially in the server mode) so that it does not waste CPU cycles to do GC if there is enough space on the heap. It usually runs GC @60-80%. Short relevant discussion on StackOverflow. |